Online Shoppers Purchasing Intention prediction
As the rapid development of Internet system in recent years, and the increasing belief that technology will become the mainstream of feature, machine learning spontaneously becomes a hot topic both in major and career choosing. Machine learning covers knowledge of probability theory, statistics, approximate theory and complex algorithms (stimulating human learning). It allows computers to deal with new situations through analysis, observation, and past experiences. By constantly proposing brand new algorithms, it has been widely used in a variety of fields.
Nowadays, with the help of the new technology and the support of the internet, online shopping has gradually developed into the main method for people all around the world for purchasing products for either daily life products or clothes and decorations. It provides customers a wide variety platform for selecting items, not only in a specific store, but from a diverse storage which includes all kinds of related items. Subsequently, online stores, like every business, want to sell as many products as possible, in order to earn profit and eventually extend their store.
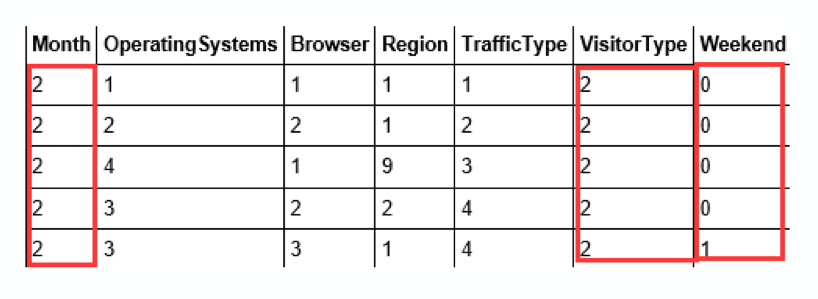
Apparently, the study of consumer preferences, known as propensity to consume, becomes important. Through machine learning, it can effectively improve this problem. I personally is a online shopping lover, so I was attracted by the topic of using computer knowledges to predict online shoppers purchasing intention. Through learning, I used a supervised learning two-class classification ML model and by inserting data into it, successively predicted the results. The dataset provided in this research comes from year-long consecutive surveys based on typical products of online shoppers, which consists of 10 numerical and 8 categorical attributes (informational, bounce rates, page values). We will use the first 17 features to predict whether Revenue is true or false. However, the data set is unbalanced so it is quite challenging since it need process and ways to get the best result. In the following paragraphs, I will explain why and the solutions to solve the problem. After being primarily organized by official statistics, it was shown visibly as a table formation, which audience can effortlessly acquire effective information. By inserting the data given, the model can predict whether a shopper will purchase an item or not. Therefor makes it more effective to produce recommended products for each consumer.
Data preprocessing and visualization are important programs after obtaining data, it typically includes data cleaning, encoding, separating, and feature scaling. For usual collected data, there is a large probability to contain missing or extreme values, then errors may occur when calculating final result. This process provides advantages and set up preparations for the analysis part following up. Also, by visualizing the data through visualization, contributes a quicker and clearer correlation than just simple text, the overall operation of the product has a significant effect.
When we make predictions, we must use some measures to evaluate the results provide by the model. For example, we can use confusion matrices. The probability of partial correct classification can be analyzed in detail. If two classification models are used, the first phase inserts the dataset into the model. Then following analysis will gives results and evaluation indicators that can determine whether or not to make an informed decision. The study of ML is of great significance, while the imbalance of the data set is mainly deficiency which brings great challenges to the prediction. It can be solved by adding new metrics to the model to improve accuracy. There are many kinds of charts, static and dynamic, each of these charts is very intuitive and some are even colorful. Each type of chart has its own advantages. For instance, a bar chart is more likely to show the overall distribution and the difference between the highest and lowest points, while a line graph is more likely to show the overall trend.
After importing the collected data into coding, we get our data image by running all cells.
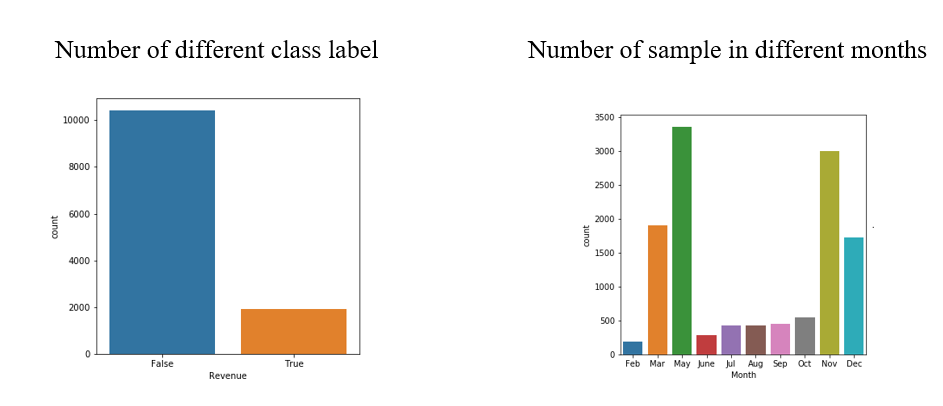
Our final goal is to use the data to predict the Revenue, this chart provide a perspicuous and colorful image to represent the result, instead of just number. That there are many people who are visual learners, and charts like this can give a more perceptual intuition.
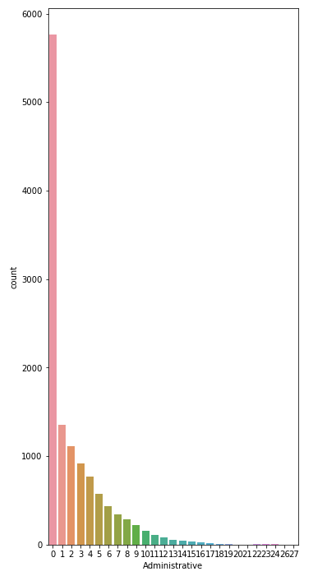
Bar charts are best in comparative data cases, since this type of charts is easy to interpret and ubiquitous. It allows people to recognize and compare the difference of each individual data at first sight. Like this chart, it is obvious that the vertex is during May and there is probably a trough in February.

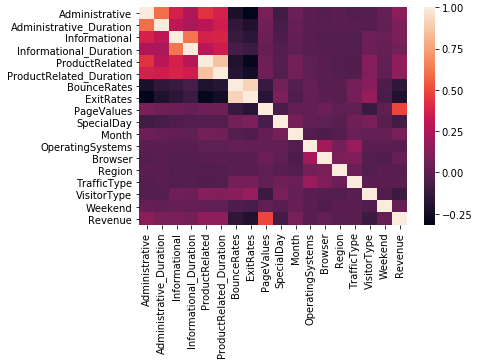
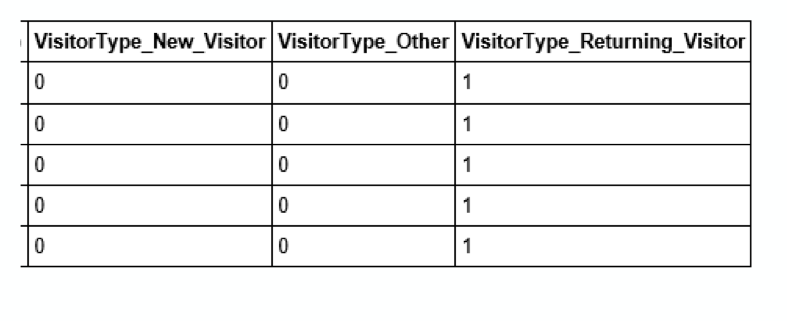
This is a typically method called on-hot coding. The map represents the result by pure color correlations: the lightest straight line ( diagonal ) is the reference standard.
The datas shown above are only a small portion among the huge data sets in our nowadays life. Everyday we interfere with numerous information, base on the purpose to find a way that can provide and select data more efficiently, people come up with the general idea of Feature Engineering. This is the process of using domain knowledge of the data to create or modify features to make machine learning algorithms work. Then we may come to the stage to think:
“ How to properly combine or extract better features? ”
“ Which features are rather less helpful to training? ”
All purpose for using techniques of feature selection is to benefit users, by choosing the suitable features will enables machine learning algorithms to train faster, also reduce the high complexity, making ease for readers to further analysis. In addition, it can also improve the accuracy of the model and reduce over-fitting. Over-fitting has a negative impact on the training of model because it will impact the result of new data set training since the model had already learned and get trained by the data set, it has “memory” so it will give a biased conclusion based on preview results.
These are also the questions I have been working on through out the study, as the goal is always to come up with a better solution than the previous one. As well as people who are actually majoring their career in machine learning right now, their interest is to incessantly developing a faster or more convenient way to select data.
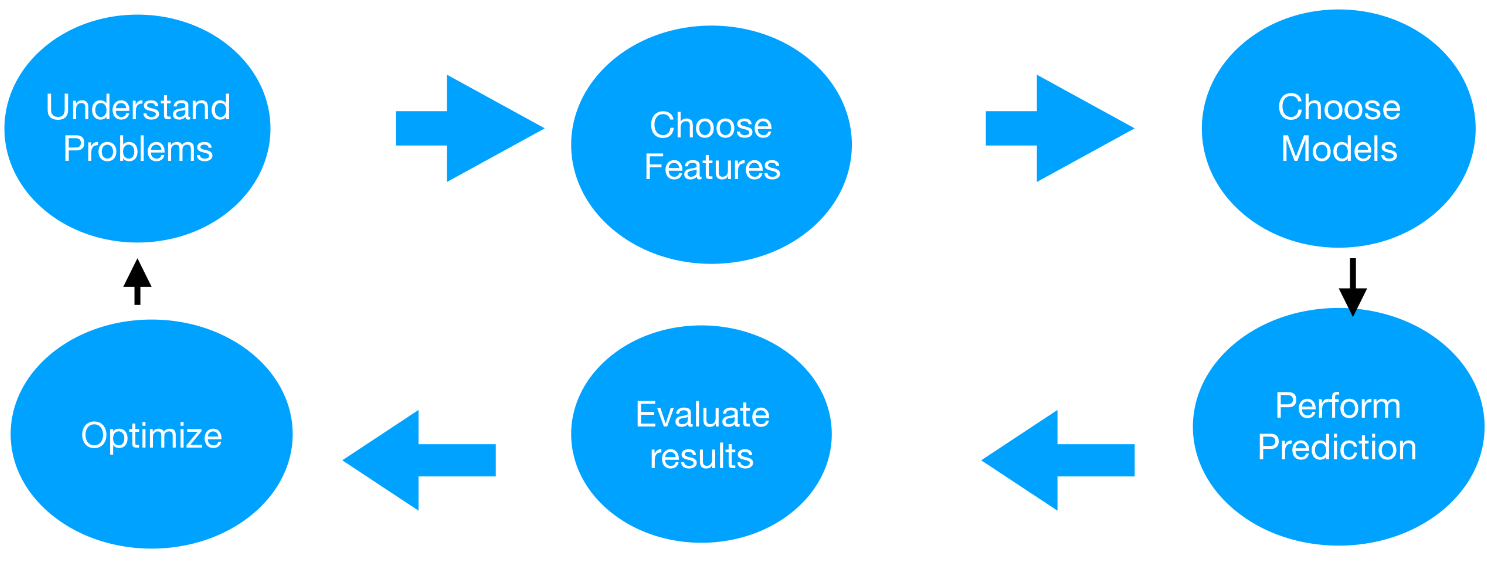
After all research and study, there can be three main sectors as a step to manage Feature Engineering.
- Standard scaler
- Encoding categorical attributes
- Feature Selection
So first of all, we standardize features by removing the mean and scaling to unit variance, since we can not adjust values measured in different scales, just like we need to convert to unified units when dealing with chemistry or physics problems. In that way, we can make them comparable and resulting in a better training result. If not elaborating this process, some particular feature that is greater or much lesser in gratitude than other features in the set may take the dominate position. And the result we get may be more complicated or contain deviations which can confuse users. Then, as we all know, computers see the information as zero or one. So in order to make the data understandable to ML algorithms, we need to encode data. There are basically two types of encoding: label encoding and one-hot encoding.
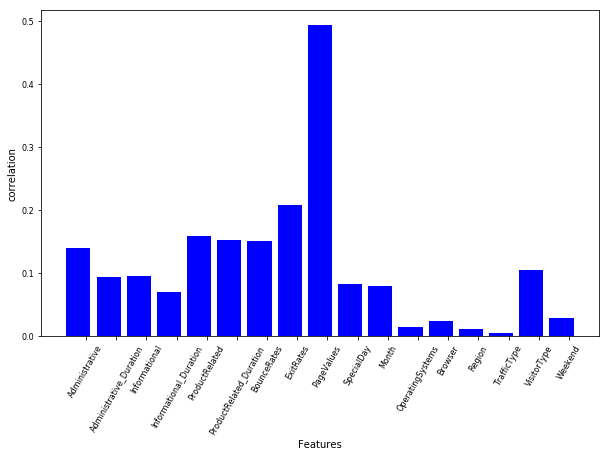
Different features have different influences or importances, and cases will vary according to the case’s situation and purpose. This is also the amazing thing about feature selection, since it is not a one time tool, but can apply to many different situation. While speaking of that, we need to think about the result of certain feature. That is also why nowadays machine learning is important, we need to be aware of what outcome will give us if we choose this feature in the case. For instance, if the situation needs detail description or any general overview, then we may use “informational” feature, or “ProductRelated”. We can also select features by visualization or mathematic metric. When doing feature selections, we need to compute the correlation coefficients among the first 17 variables and the Revenue. Correlation coefficient are used to measure the strength of the relationship of two variables. As mention before, for predicting online shoppers purchasing intension, we are given 17 variables at first to predict whether Revenue is true or false. The result of Revenue will provide us evidence for the final outcome and conclusion. When the correlation coefficient is low between on variable and Revenue, we will discard that viable for future measurement since it will not provide useful information and make no variation by discarding it, but create benefit by improving speed and better visualized result.
It is worth mentioning a greedy optimization for finding the best performing subset of features, which is Recursive feature elimination. It is called a greedy process because it function to repeatedly construct a model and select the best and worst result for each loop. The loop will stop after all features are frazzled. Then, it will rank the features according to their time of when they are eliminated. This can be seen as the same concept with correlation coefficient since they both shows how strong the relationship for one feature with the Revenue in some degrees. Although it is considered a greedy way to generate solutions, it is still used since the time efficiency it contains. We talk about the word “model” a lot, so it is quite necessary to know the definition of the word in ML. It can be said that a machine learning model is usually a mathematical or statistical algorithm with trained parameters over a training class.
There are mainly two important methods used for model selection: Logistic Regression and KNN. A machine learning model is usually a mathematical or statistical algorithm with trained parameters over a training class. Imagine a random dot plot, linear regression is the approach of trying to have a linear line which minimize the mean square error of all the dots. The line, which is the only dependent variable, and the dots are independent variables in this case; linear regression is a linear approach to modeling the relationship between a dependent variable and one or more independent variables.
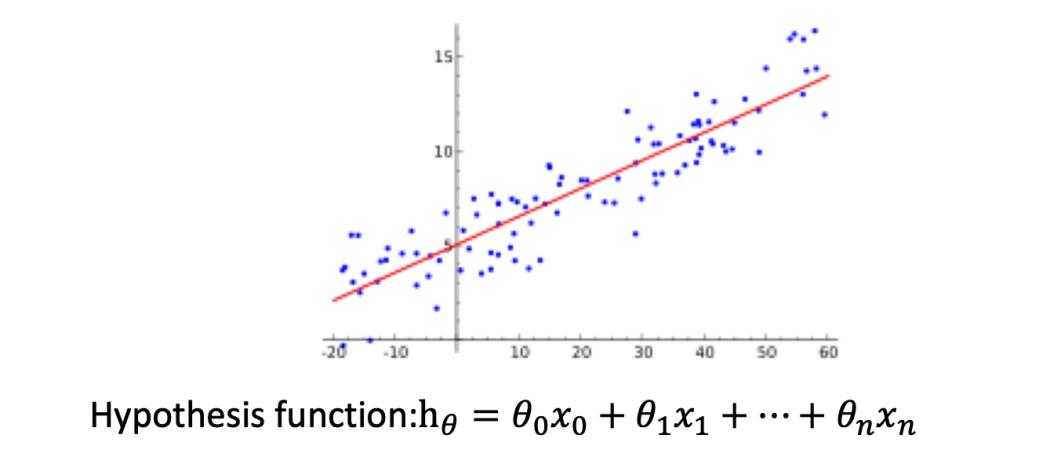
As shown in the below graph, the red line is the function, it shows the line of best fit of all scattered dots, which can be seen as a trend measurement.
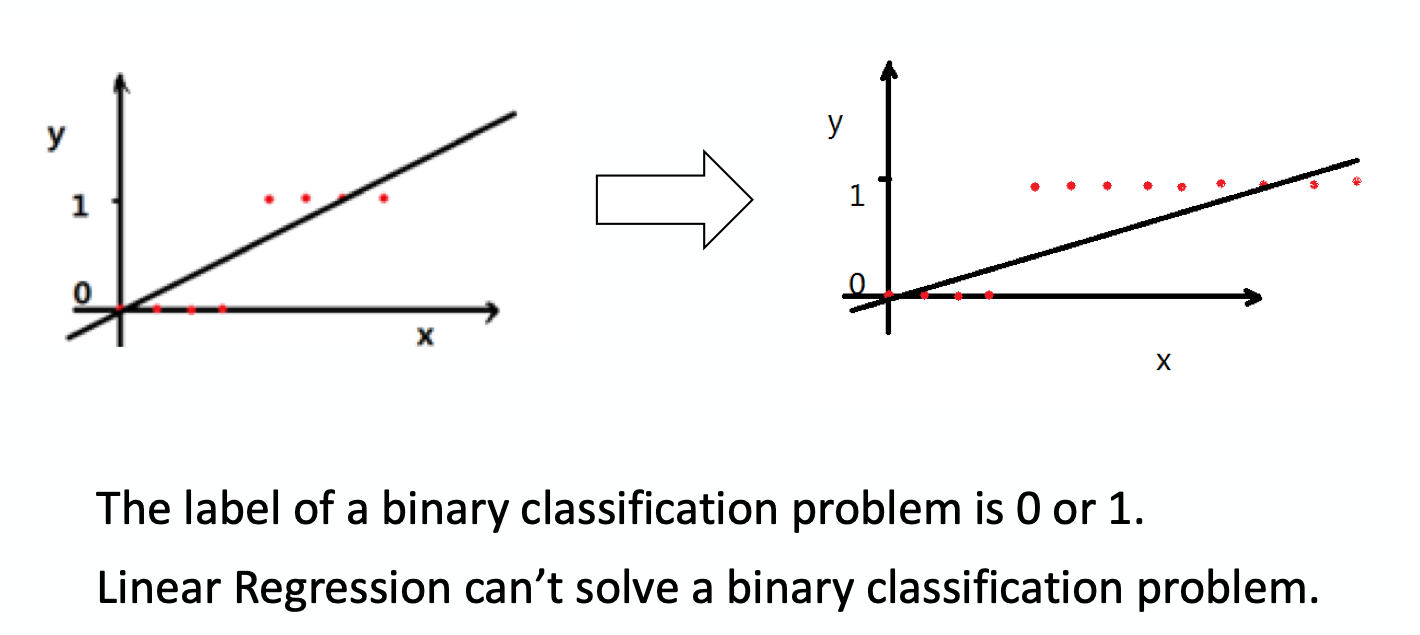
There is another representative function, the Logistic function, it can also be called Sigmoid function
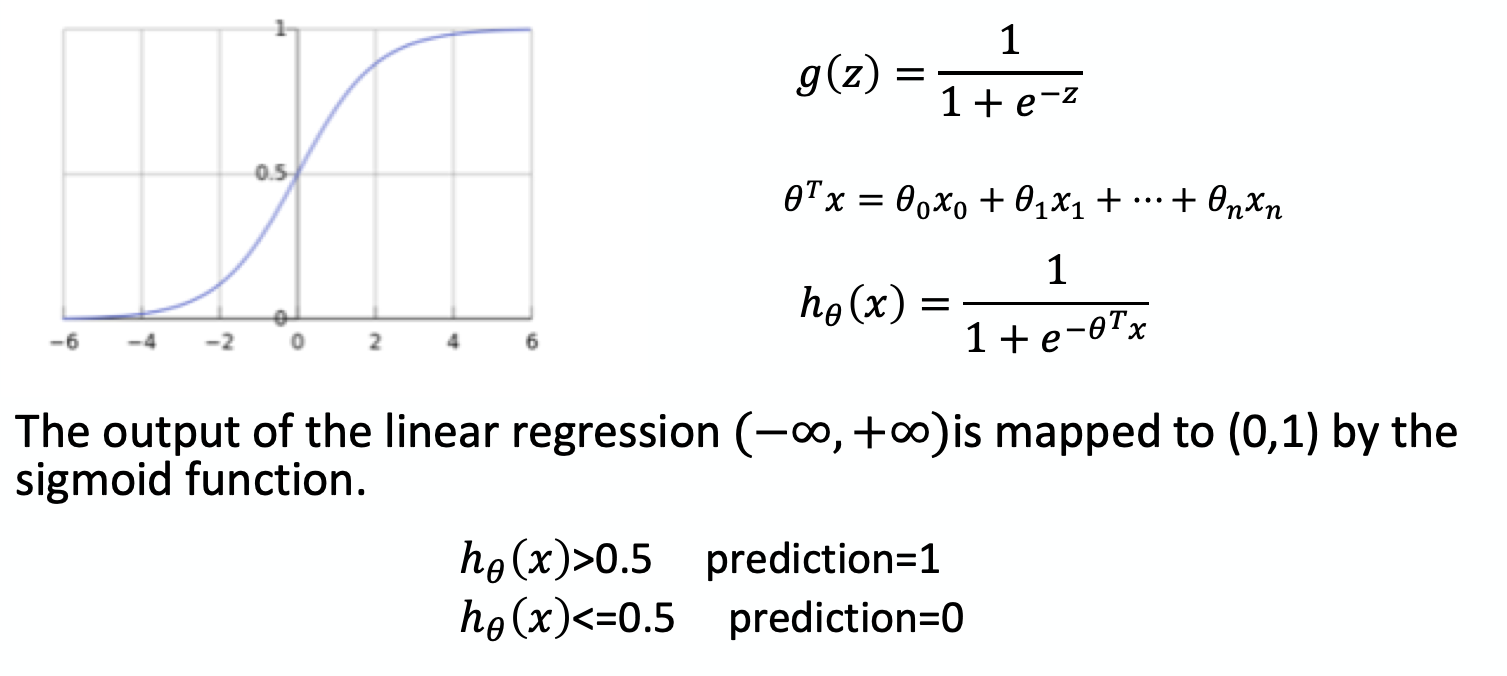
Logistic Regression, which is also used in Statistics, it can take any real number and changed them into 0 and 1, in its functional graph ( sigmoid function ).
The k-nearest neighbors algorithm (KNN) is a method used for classification. KNN model represents the “nearest neighbors algorithm”, used for classifications. The neighbors are taken from a set of objects for which the class is known. The input consists of the k closest training examples in the feature space, the output is a class. An object is classified by a plurality vote of its neighbors, with the object being assigned to the class most common among its k nearest neighbors (k is a positive integer, typically small). If k = 1, then the object is simply assigned to the class of that single nearest neighbor. The neighbors are taken from a set of objects for which the class is known. This can be thought of as the training set for the algorithm, though no explicit training step is required.
The test sample (green dot) should be classified either to blue squares or to red triangles. If k = 3 (solid line circle) it is assigned to the red triangles because there are 2 triangles and only 1 square inside the inner circle. If k = 5 (dashed line circle) it is assigned to the blue squares (3 squares vs. 2 triangles inside the outer circle.)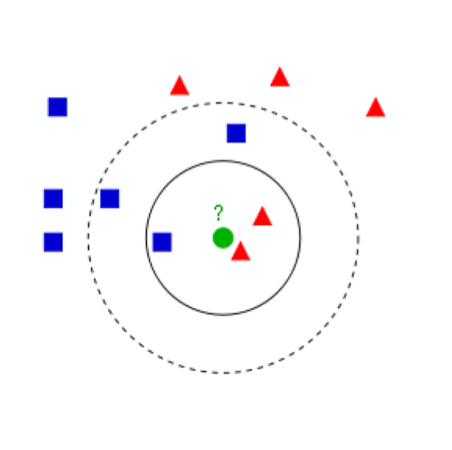
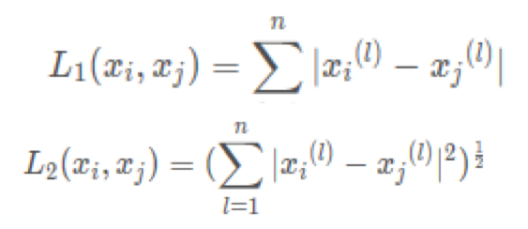
Parameter n_neighbors: the number of neighbors
Parameter p: the type of distance
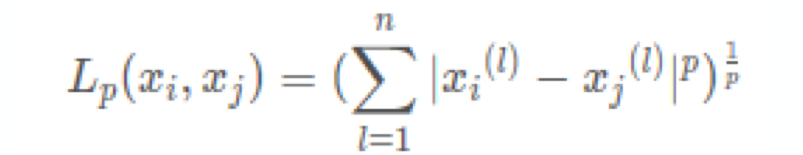
p = 1:Manhattan Distance
p = 2: Euclidean distance
The main difference between KNN and Logistic Regression is KNN needs to store every value no matter is the trained data or the new data and distance among them. Since it needs to remember all locations to proceed the measurement, when the data sets get really big or in complex cases, this actually turns the model into a disadvantage. There is too much for the model to process, and the purpose of models is to be concise. Where as Logistic Regression only needs to insert the new viable in the previous data set.
The training data set has to be different with the new data, since we do not want the model to have bias, for instance it has seen the data before. The way we use before to solve this problem is to assign value to the test and training data. For example set 20% to test, and 80% dat to train. Just like chemistry labs, the value we signed are based on hypotheses, they are not accurate and may actually produce similar results, or in opposite, the result can also be very different. In that way, we user cross-validation to have a more convincible average, and balance the error of the result. The only parameter is K, the repeating time.
The general procedure of cross validation is to first shuffle a data set randomly, and then split it into k groups. Then for each unique groups, we take one as the test data set and take the remaining groups as a training data set. Fit a model on the training set and evaluate it on the test set, finally retain the evaluation score and discard the model and summarize the skill of the model using the sample of model evaluation scores.
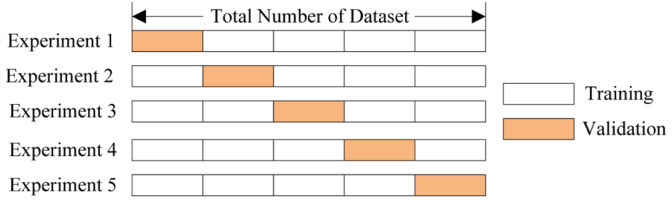
Like the graph, it has 5 folders so we will than get 5 different result from 5 different models, and then we calculate the test(validation) set average. This is a more convincible result since it considered different cases, thus not extreme.
Cross-validation is a resampling procedure used to evaluate machine learning models on a limited data sample. The single parameter called k that refers to the number of groups that a given data sample is to be split into. As such, the procedure is often called k-fold cross-validation. When a specific value for k is chosen, it may be used in place of k in the reference to the model, such as k=10 becoming 10-fold cross-validation. The purpose of doing cross-validation is to prevent overfitting.
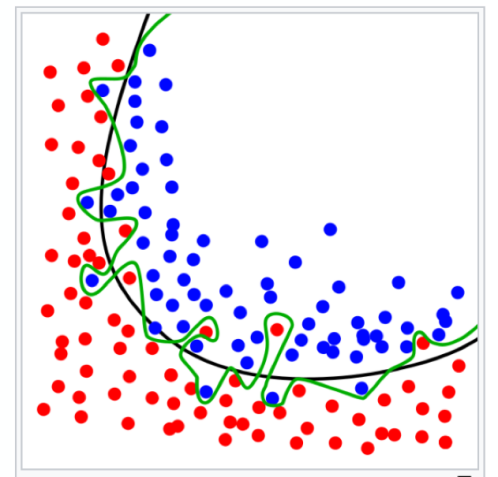
As shown in the left-hand graph, the green line represents and overfitted model and the black line represents a regularized model. While the green line best follows the training data, it is too dependent on that data and it is likely to have a higher error rate on new unseen data, compared to the black line. For instance, as in the graph, we can see that the green line includes certain amounts of blue dots that are not supposed to be included (just like the range for the black line), in this way, those dots will be considered as error for new data sets.
(cannot generalize to other new models)
Training error is shown in blue, validation error in red. both as a function of the number of training cycles. If the validation error increases(positive slope) while the training error steadily decreases( negative slope) then a situation of overfitting may have occurred. The best predictive and fitted model would be where the validation error has its global minimum.
How can we improve KNN:
In model KNN, we have 2 variables: k and p that we can change. We can use gridSearch to change them, it can find all of the combination of k and p (k and p are both integer). We need to turn the parameter because we do not know which choice can produce the best result. The best score I get from my model is 87%, 9 neighbor which we first choice 5 neighbor.
How can we improve Logistic Regression:
We have 17 variables, by reducing some, we can get a bette result, since they might be a problem of overfitting. Also, for all data set now, we only did some data normalization, while it will not impact the result very dramatically. We can add some new variables, For instance, we final result will not be much related with Page Value, since it has the biggest correlation when we do feature selection. So there night not be much correlation between itself and the final result but the square or double square of it. So we can add a new variable, Page Value Square to process recursing feature selection, this will give us the most valuable variate.
Final Results:
best_score 0.876520681265
best_params {‘weights’: ‘uniform’, ‘p’: 2, ‘n_neighbors’: 9}
0.878345498783
In this project, I used KNN and Logistic Regression to predict online shoppers’ purchasing intension, I find the feature of the model by feature selection and data normalization. I tested several machine learning models by cross-validation. I uses bigger factors of variables to generate the best results. However, situation varies in different cases, each model has own limitation. Where as in this project, since all variables are a one to one relationship with “revenue”, the correlation coefficient is one. The result of the model has a best score of 0.876529681265, which indicates the average rate is approximately 87.8%.
With the progressing of this research, I not only learned knowledge of machine learning in lecture, but also improved my ability to understand, program code and to do researches. I learn how to expend my thoughts based on an idea and the way to further assists the idea with knowledge learned according to teachers. This project also benefits me in my school computer science course, enable me to do further explore base on this topic.
citation:
Sakar, C. Okan, et al. “Real-time prediction of online shoppers’ purchasing intention using multilayer perceptron and LSTM recurrent neural networks.” Neural Computing and Applications 31.10 (2019): 6893-6908.